What if your print fleet is costing 40% more than necessary, but you can’t prove it to leadership because you don’t have the data? For IT directors managing distributed print environments across Pennsylvania, Maryland, and Virginia, this isn’t a hypothetical—it’s a daily reality. According to Gartner research, companies spend up to 3% of annual revenue on printing, yet 90% can’t track costs by department or user. Without visibility, you can’t optimize. Without data, you can’t make the business case for change.
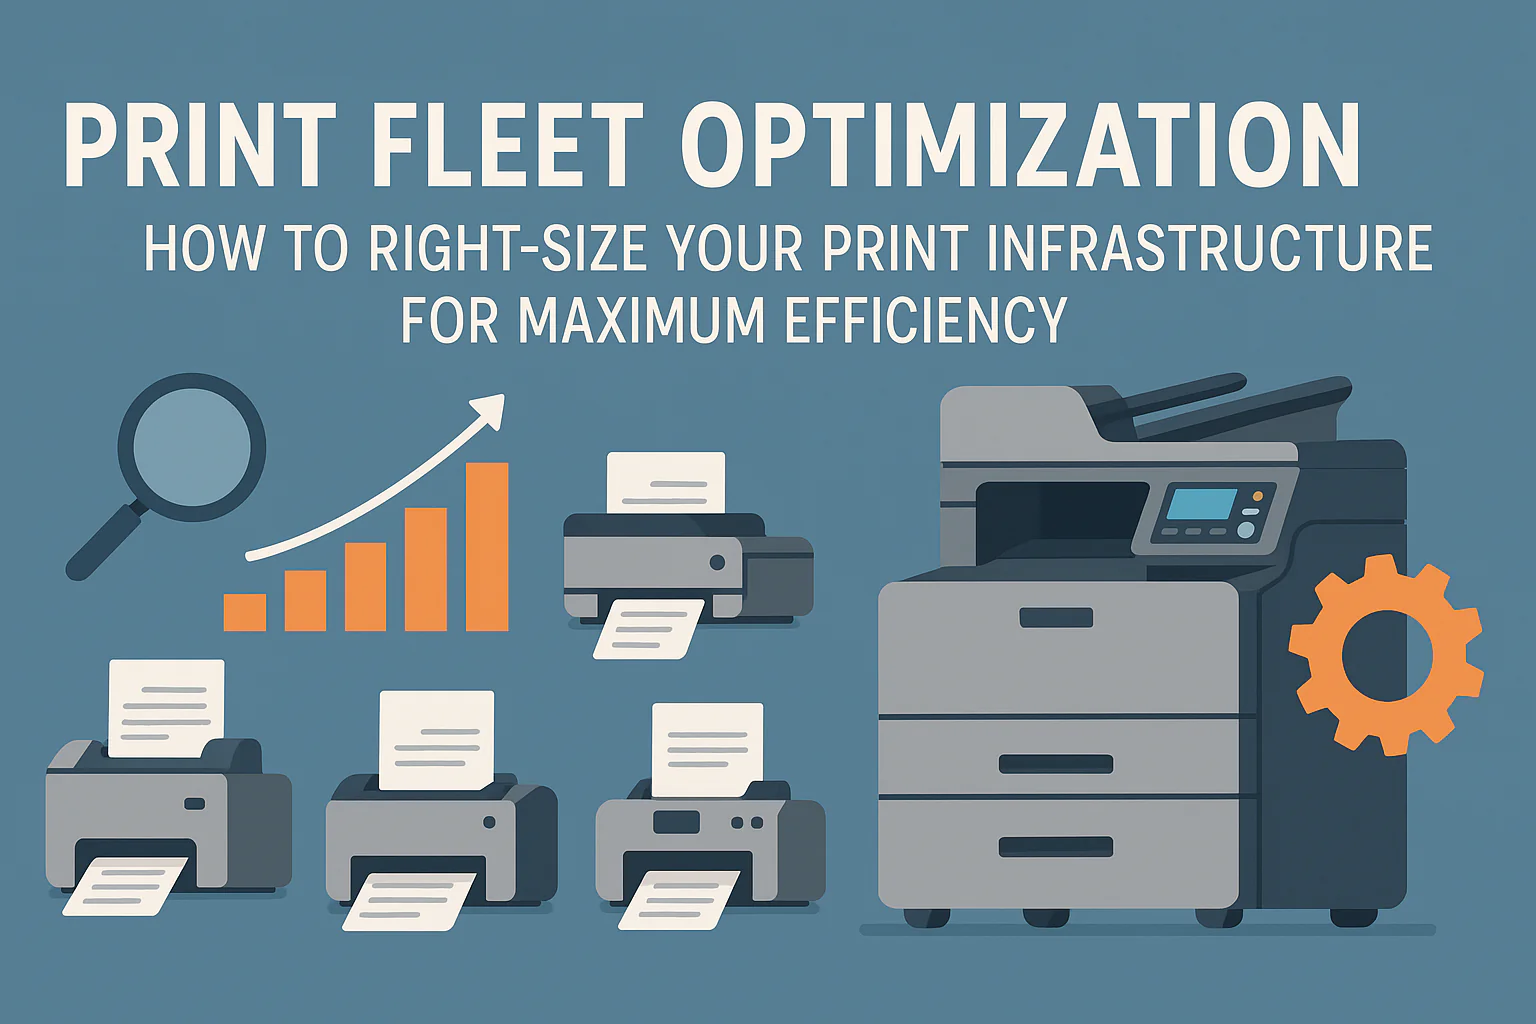
Print fleet optimization starts with visibility: understanding what devices you have, how they’re being used, and what they’re actually costing per page. Organizations implementing structured fleet optimization typically reduce total print costs by 20-30% within the first year through device consolidation, strategic placement, and usage accountability. The process doesn’t require expensive consultants or immediate vendor commitments—just a systematic approach to gathering data, calculating true total cost of ownership, and making evidence-based decisions about which devices stay, which go, and where gaps exist.
What we’ll cover:
- How to conduct a comprehensive print fleet audit in 3-5 days
- The true total cost of ownership formula (beyond just supplies)
- Strategic device placement: matching capabilities to actual workflow needs
- When consolidation makes sense vs. when distributed devices win
- Building the ROI case for leadership approval
- What to optimize first for fastest payback
Why Most Print Fleets Cost More Than They Should
Print fleets rarely start optimized. They grow organically—a department head orders a desktop printer without IT approval, reception gets a new device because the old one “seemed slow,” finance keeps three separate units “just in case.” Over five years, what started as a strategic deployment of eight devices becomes an unmanaged collection of 23, spread across multiple vendors, models, and service contracts.
Three cost drivers compound the problem. Device sprawl multiplies maintenance complexity and supply chain overhead—every additional device type requires different toner SKUs, separate service contracts, and unique troubleshooting knowledge. Mismatched capacity wastes capital on both ends: oversized devices that cost $8K but print 400 pages monthly, and undersized units handling 3,000 pages monthly when they’re rated for 800, driving up service calls and premature failure. Invisible waste persists because nobody tracks it: unclaimed jobs sitting in output trays, color printing for black-and-white drafts, single-sided output when duplex would suffice, documents printed then immediately scanned back into digital workflow.
Organizations throughout the Mid-Atlantic region face identical patterns. Without structured auditing, you’re managing print infrastructure reactively—responding to breakdowns, ordering supplies as they run out, and approving new device requests without understanding total fleet economics.
💡 Doceo Pro Tip: Track service calls per device annually. If any unit generates 4+ calls per year, it’s either undersized for usage or reaching end-of-life. This single metric identifies optimization candidates faster than any other indicator.
The 5-Day Print Fleet Audit Framework
Comprehensive fleet assessment doesn’t require weeks of consultant time. With systematic approach and internal resources, most IT directors complete thorough audits in 3-5 business days.
Day 1-2: Device inventory and location mapping. Start with your IT asset management system, but don’t stop there. Walk every floor, check every office, visit storage rooms and copy centers. You’re looking for three categories: tracked devices under active management, untracked “ghost devices” that bypassed procurement, and retired equipment still consuming electricity in corners. For each device, document make, model, serial number, physical location, network connectivity, and age.
Hypothetical example: A manufacturing company in Frederick, MD (85 employees) conducted this exercise expecting to confirm 14 tracked devices. They discovered 14 tracked units plus six untracked desktop printers purchased through individual department budgets, two “retired” copiers still plugged in and functional, and one 12-year-old fax machine nobody admitted to using but that printed 40 pages weekly.
Day 3: Usage pattern analysis. Modern networked devices provide detailed usage data through embedded web interfaces or print management software platforms. For each device, extract three months of data: total page volume, color vs. black-and-white ratios, average job sizes, peak usage times, and scan/copy/fax utilization if applicable. For devices without network reporting, estimate usage from supply replacement frequency—a standard toner cartridge yields approximately 3,000 pages at 5% coverage.
Day 4: Cost data gathering. Calculate actual spending per device across four categories. Hardware costs include purchase price or lease payments divided by expected service life. Supply costs encompass toner, ink, drums, maintenance kits, and paper allocated to specific devices. Service costs include both contract coverage and break-fix incidents. Energy costs use actual power consumption specifications multiplied by your kWh rate and estimated duty cycle.
✔️ Doceo Pro Tip: Don’t rely on IT asset management alone. Walk the building. You’ll find “ghost devices” that haven’t been tracked in years but are still incurring costs. We’ve seen organizations discover 30% more devices than their asset database showed.
Day 5: User workflow interviews. Data tells you what’s happening; conversations tell you why. Interview department heads and power users to understand document workflows: What document types do they create? What security or compliance requirements exist? Where do bottlenecks occur? What workarounds have they developed? A 10-minute conversation often reveals that accounting prints everything because they don’t trust scan-to-folder reliability, or that reception uses color printing for routine documents because nobody disabled it.
Calculating True Total Cost of Ownership
Cost-per-page estimates based solely on supplies miss 60-70% of actual expenses. True total cost of ownership requires comprehensive calculation.
The TCO formula: TCO per page = (Hardware depreciation + Supplies + Service + Energy + IT support time) / Total pages printed annually
Hardware depreciation: Purchase price or total lease payments divided by expected service life (typically 5 years for A3 MFPs, 3-4 years for A4 printers) divided by expected lifetime page volume. A $6,000 MFP with 300,000-page duty cycle and 5-year life costs $0.02/page in hardware depreciation.
Supplies: Actual expenditure on toner, ink, drums, fusers, and maintenance kits over measurement period divided by pages printed. Include paper costs if allocating by device. Track separately for color vs. black-and-white output—color toner typically costs $0.08-0.12/page vs. $0.01-0.02/page for black-and-white.
Service: Annual contract cost plus any break-fix incidents divided by annual page volume. Many organizations underestimate this component by excluding IT time spent troubleshooting, which often exceeds formal service contract costs.
Energy: Device power consumption in watts multiplied by duty cycle percentage multiplied by kWh rate. An 800-watt device running 4 hours daily at $0.12/kWh costs approximately $140 annually, or $0.003-0.005/page depending on volume.
IT support time: Hidden but substantial. Track help desk tickets, estimate resolution time, multiply by IT hourly cost. For organizations without managed IT services, IT support often represents 15-25% of total print costs.
💡 Doceo Pro Tip: Calculate cost-per-page including ALL factors. That $200 desktop printer often costs $0.18/page when you factor in low cartridge yield and service. A $6K MFP might cost $0.04/page. The device with the lowest acquisition cost frequently has the highest TCO.
When you run these calculations across your fleet, patterns emerge. Desktop inkjet printers consistently show TCO of $0.12-0.18/page. Small A4 laser printers fall in the $0.06-0.10/page range. Strategic A3 multifunction devices with appropriate volume typically achieve $0.03-0.05/page. High-volume production equipment can reach $0.02/page or less.
Strategic Device Placement: The Decision Framework
Fleet optimization isn’t about eliminating devices—it’s about matching capabilities to actual workflow requirements at optimal cost per page.
Centralized A3 MFPs make sense when: Department size exceeds 15-20 people, monthly volume exceeds 3,000 pages, users need scan-to-folder or scan-to-email functionality regularly, finishing requirements include stapling or hole-punching, or document security requires user authentication. Centralized placement encourages staff movement (reducing sedentary behavior), creates natural collaboration points, and consolidates service complexity.
Distributed A4 printers make sense when: Physical distance makes centralized access impractical (manufacturing floor, warehouse, remote building), print volume is genuinely low (under 500 pages monthly), departmental workflow requires immediate output (reception, shipping), or specialized output is needed (label printers, wide-format drafting).
Example scenario: A professional services firm in Baltimore with 120 employees conducted workflow analysis across departments. Accounting (18 staff, 4,200 pages monthly) needed scan-to-folder for client document management and secure print release for financial statements—optimal solution: one A3 MFP with authentication. Reception (2 staff, 300 pages monthly) needed quick access for visitor badges and correspondence—optimal solution: single-function A4 laser printer. Marketing (8 staff, 1,800 pages monthly) needed color capability for client presentations—optimal solution: color A4 MFP shared between marketing and sales.
The decision framework asks five questions for each location: What’s the actual monthly page volume? What percentage requires color? What finishing or special features are mandatory vs. nice-to-have? How many users will access this device? What security or compliance requirements exist?
💡 Doceo Pro Tip: Right-size capacity to actual usage. Don’t deploy a 60-page-per-minute A3 device where you print 500 pages monthly. Oversized devices have higher acquisition costs, larger physical footprints, and more expensive supplies with no productivity benefit. Match device speed ratings to actual volume with 20-30% headroom for growth.
Placement strategy also considers workflow sequences. If users regularly print documents then walk to a scanner, you’re wasting time and maintaining two devices. A single multifunction device eliminates redundancy. If users print from laptops in conference rooms, mobile printing capability or pull-printing (where jobs follow users to any authenticated device) prevents the “forgot to print before the meeting” scramble.
Consolidation Strategy: What to Keep, What to Replace
Device-by-device analysis reveals optimization candidates. Five criteria determine retirement priority.
Service call frequency: Any device generating 4+ service calls annually costs more in IT disruption than replacement would. High-maintenance devices signal fundamental mismatch between duty cycle and usage pattern or approaching end-of-life.
Age and supportability: Devices beyond manufacturer-supported service life create risk. Parts availability declines, firmware updates cease, security vulnerabilities emerge. If your manufacturer discontinued the model, plan replacement.
Utilization efficiency: Calculate pages per month against device rating. Units printing under 10% of rated capacity are oversized and expensive. Units exceeding 80% of rated capacity are undersized and prone to failure. Both indicate poor matching of capability to need.
Supply cost per page: Compare actual supply costs against industry benchmarks. Devices with supply costs exceeding $0.08/page for black-and-white output or $0.15/page for color output flag inefficiency—either the device itself is inefficient, or usage patterns (excessive color, low cartridge yield) create waste.
Total cost of ownership ranking: Sort all devices by calculated TCO per page. The top quartile (highest TCO) identifies immediate replacement candidates if volume justifies more efficient alternatives.
💡 Doceo Pro Tip: Standardize within device classes. Running 3 A3 models and 5 A4 models multiplies support complexity. Pick proven platforms from partners like Toshiba, Kyocera, or Epson and consolidate. Fewer models means simpler supply management, faster technician response, and volume purchasing leverage.
Consolidation doesn’t mean wholesale replacement. Phased approach targets highest-impact opportunities first. Replace devices with highest TCO, eliminate low-utilization units, consolidate overlapping functionality, then address remaining fleet. Many organizations discover they can eliminate 30-40% of devices with zero workflow disruption through strategic consolidation alone.
Building the Business Case for Leadership
Data-driven recommendations require executive presentation that addresses CFO concerns: capital requirements, ongoing cost impact, payback timeline, and risk mitigation.
Executive summary format: Current state (devices, annual cost, key problems), proposed state (device plan, projected annual cost, efficiency improvements), investment required (hardware, implementation, training), financial impact (annual savings, payback period, 3-year total savings), and implementation timeline.
CFOs care about payback period above all other metrics. Calculate investment (hardware purchases or lease commitments plus implementation costs) divided by annual savings to determine months until break-even. Most fleet optimization projects achieve payback within 12-18 months with 20-30% ongoing annual savings.
Across our Mid-Atlantic client base, organizations implementing comprehensive fleet optimization report consistent patterns: 25-40% reduction in total device count, 20-30% reduction in annual print-related spending, 50-60% reduction in print-related IT help desk tickets, and improved security posture through centralized authentication and monitoring.
Frame risk mitigation as business continuity. Aging devices fail unpredictably, creating workflow disruption during critical periods. Strategic replacement on controlled timeline prevents crisis purchasing at premium pricing. Security vulnerabilities in unpatched legacy devices create compliance exposure. Managed print services with proactive monitoring further reduce downtime risk.
Three-year financial projection strengthens the case. Show not just Year 1 savings but cumulative impact. A $40K investment yielding $28K annual savings produces $44K net benefit over three years—compelling ROI for most CFOs.
💡 Doceo Pro Tip: Before presenting to leadership, pilot changes in one department. Demonstrable results in accounting or operations provide proof of concept that overcomes skepticism. “We reduced accounting’s print costs 27% with zero workflow complaints” carries more weight than projected savings.
What to Optimize First for Fastest Payback
Not all optimization delivers equal ROI velocity. Prioritize changes by implementation speed and savings impact.
Quick wins (implement within 30 days): Eliminate ghost devices and unused equipment. Zero cost, immediate savings on supplies and service. Enable duplex (double-sided) printing as default across all devices—reduces paper consumption 25-40% overnight. Disable color printing for users who don’t need it, reducing supply costs by 50-70% for those users. Configure secure print release to require authentication before output, eliminating unclaimed jobs (typically 8-12% of total volume).
Medium-term optimization (30-90 days): Consolidate underutilized devices in departments with multiple low-volume printers. Standardize device platforms where lease expiration or end-of-life creates natural replacement opportunity. Implement print management software for usage visibility and policy enforcement.
Strategic optimization (90+ days): Complete fleet replacement on phased schedule aligned with budget cycles and lease expirations. Implement managed print services for proactive maintenance and supply management. Integrate print authentication with existing access control systems.
Organizations throughout Pennsylvania, Maryland, and Virginia find that quick wins fund subsequent phases. The $12K saved by eliminating unused devices and enabling duplex defaults provides budget for print management software deployment. First-year savings from consolidation justify strategic fleet replacement in Year 2.
Ready to Optimize Your Print Fleet?
Print fleet optimization transforms one of IT’s most frustrating cost centers into a well-managed, predictable operational expense. The audit framework provided here enables you to gather data, calculate true costs, and build defensible recommendations without external consultants or vendor pressure.
Most IT directors discover they already possess 80% of needed information—it just hasn’t been compiled systematically and analyzed holistically. The remaining 20% comes from walking the building, interviewing users, and asking better questions about why current state persists.
Whether you implement changes independently or eventually partner with managed print services providers for ongoing support, starting with comprehensive internal assessment ensures you make decisions from position of knowledge rather than vendor recommendations alone.
Frequently Asked Questions
How long does a comprehensive print fleet audit take?
Most organizations complete thorough fleet assessments in 3-5 business days using internal resources. Day 1-2 covers physical inventory and location mapping. Day 3 focuses on usage data extraction from network-connected devices. Day 4 addresses cost data compilation across supplies, service, and energy. Day 5 includes user workflow interviews. Smaller organizations (under 50 employees) often complete audits in 2-3 days, while larger distributed environments may require a full week for comprehensive coverage.
What's the typical ROI timeframe for fleet optimization?
Organizations typically achieve payback within 12-18 months with 20-30% ongoing annual savings. Quick wins like eliminating unused devices and enabling duplex defaults deliver immediate returns with zero capital investment. Strategic consolidation requiring device replacement shows longer payback (18-24 months) but produces larger cumulative savings over three-year lifecycle. According to Gartner research, organizations implementing structured fleet optimization report up to 30% reductions in total print-related expenses, with most savings realized within the first year.
Do we need to work with a managed print services provider?
Not initially. The audit framework and TCO analysis described here can be completed entirely with internal resources, providing data-driven understanding of current state and optimization opportunities. Many organizations implement quick wins and consolidation strategies independently before evaluating whether ongoing managed services add value. MPS becomes most relevant for organizations lacking internal capacity for proactive monitoring, supply management, and maintenance coordination. Start with internal assessment, implement high-impact changes, then evaluate if MPS addresses remaining gaps.
How many devices should we have per employee?
No universal ratio exists—optimal device count depends on workflow requirements, not headcount. A 100-person accounting firm with heavy document processing might need 8-10 strategically placed devices, while a 100-person software development company might need only 3-4. Focus on matching device capacity to actual usage patterns within departments rather than applying arbitrary employee-to-device ratios. Usage analysis (pages per month per location) reveals true requirements better than headcount calculations.
What if we've already consolidated our fleet?
Fleet optimization isn't one-time project—it's ongoing process. Organizations change, workflows evolve, technology advances, and devices age. Even recently optimized fleets benefit from annual reviews addressing usage pattern shifts, emerging security requirements, and device lifecycle planning. Technology improvements in energy efficiency, print management software capabilities, and mobile printing may justify updates even if current fleet performs adequately. Continuous improvement approach ensures fleet remains aligned with business needs rather than becoming static infrastructure that gradually drifts toward inefficiency.
Should we standardize on one brand or maintain multi-vendor fleet?
Standardization within device classes reduces operational complexity significantly. Running multiple A3 brands multiplies supply SKUs, fragments service relationships, and complicates technician training. Most organizations benefit from standardizing on 1-2 proven platforms for A3 multifunction devices and 1-2 platforms for A4 printers. However, workflow needs trump brand loyalty—if specific departments require capabilities best delivered by particular vendors, strategic multi-vendor deployment makes sense. The goal is minimizing unnecessary variety while preserving functionality critical to business operations.
Take Control of Your Print Costs
Not sure if your print fleet is costing more than it should?
Send us your current device list and last 3 months of usage reports. We’ll run a comprehensive fleet analysis showing exactly where you’re overspending and what a rightsized environment would look like—typically delivered within 48 hours.
No obligation. No pressure. Just clear numbers and practical recommendations.
Schedule Your FREE Print Fleet Assessment
Questions? Call our York office at 888-757-6629 or Talk to a Print Technology Advisor