A managed IT scorecard gives CEOs and executive teams a clear way to measure whether their IT partner is actually reducing risk, improving reliability, and supporting the business. Most business leaders don’t fire a managed IT provider because of one big disaster. They make a change after months (or years) of the same frustrating pattern:
-
“We’re paying a lot… but I can’t tell what we’re getting.”
-
“Tickets get closed, but the same issues keep coming back.”
-
“Security feels like a black box.”
-
“Everything is ‘fine’… until it isn’t.”
If you’re a CEO, CFO, COO, or department leader, you’re not looking for a 40-page technical report. You’re looking for clarity:
Is our IT partner reducing risk, improving reliability, and making the business more productive—measurably?
That’s what this article is: a practical Managed IT Scorecard you can use to evaluate performance every month—without becoming an IT expert.
And there’s a bigger reason this matters now: modern cybersecurity guidance is putting more emphasis on governance—meaning security and risk decisions shouldn’t live only in IT. They belong at the leadership table. The NIST Cybersecurity Framework 2.0 even added a new core function: “Govern.”
So let’s build the scorecard.
Why a Managed IT Scorecard Beats “How Do You Feel About IT?”
Feelings are valid—but they’re not measurable.
A scorecard gives you three big advantages:
-
You stop relying on anecdotes. One loud incident doesn’t define a quarter.
-
You get trendlines. If patching, backups, phishing risk, or response times are slipping, you’ll see it early.
-
You create accountability. Not blame—accountability. The good kind.
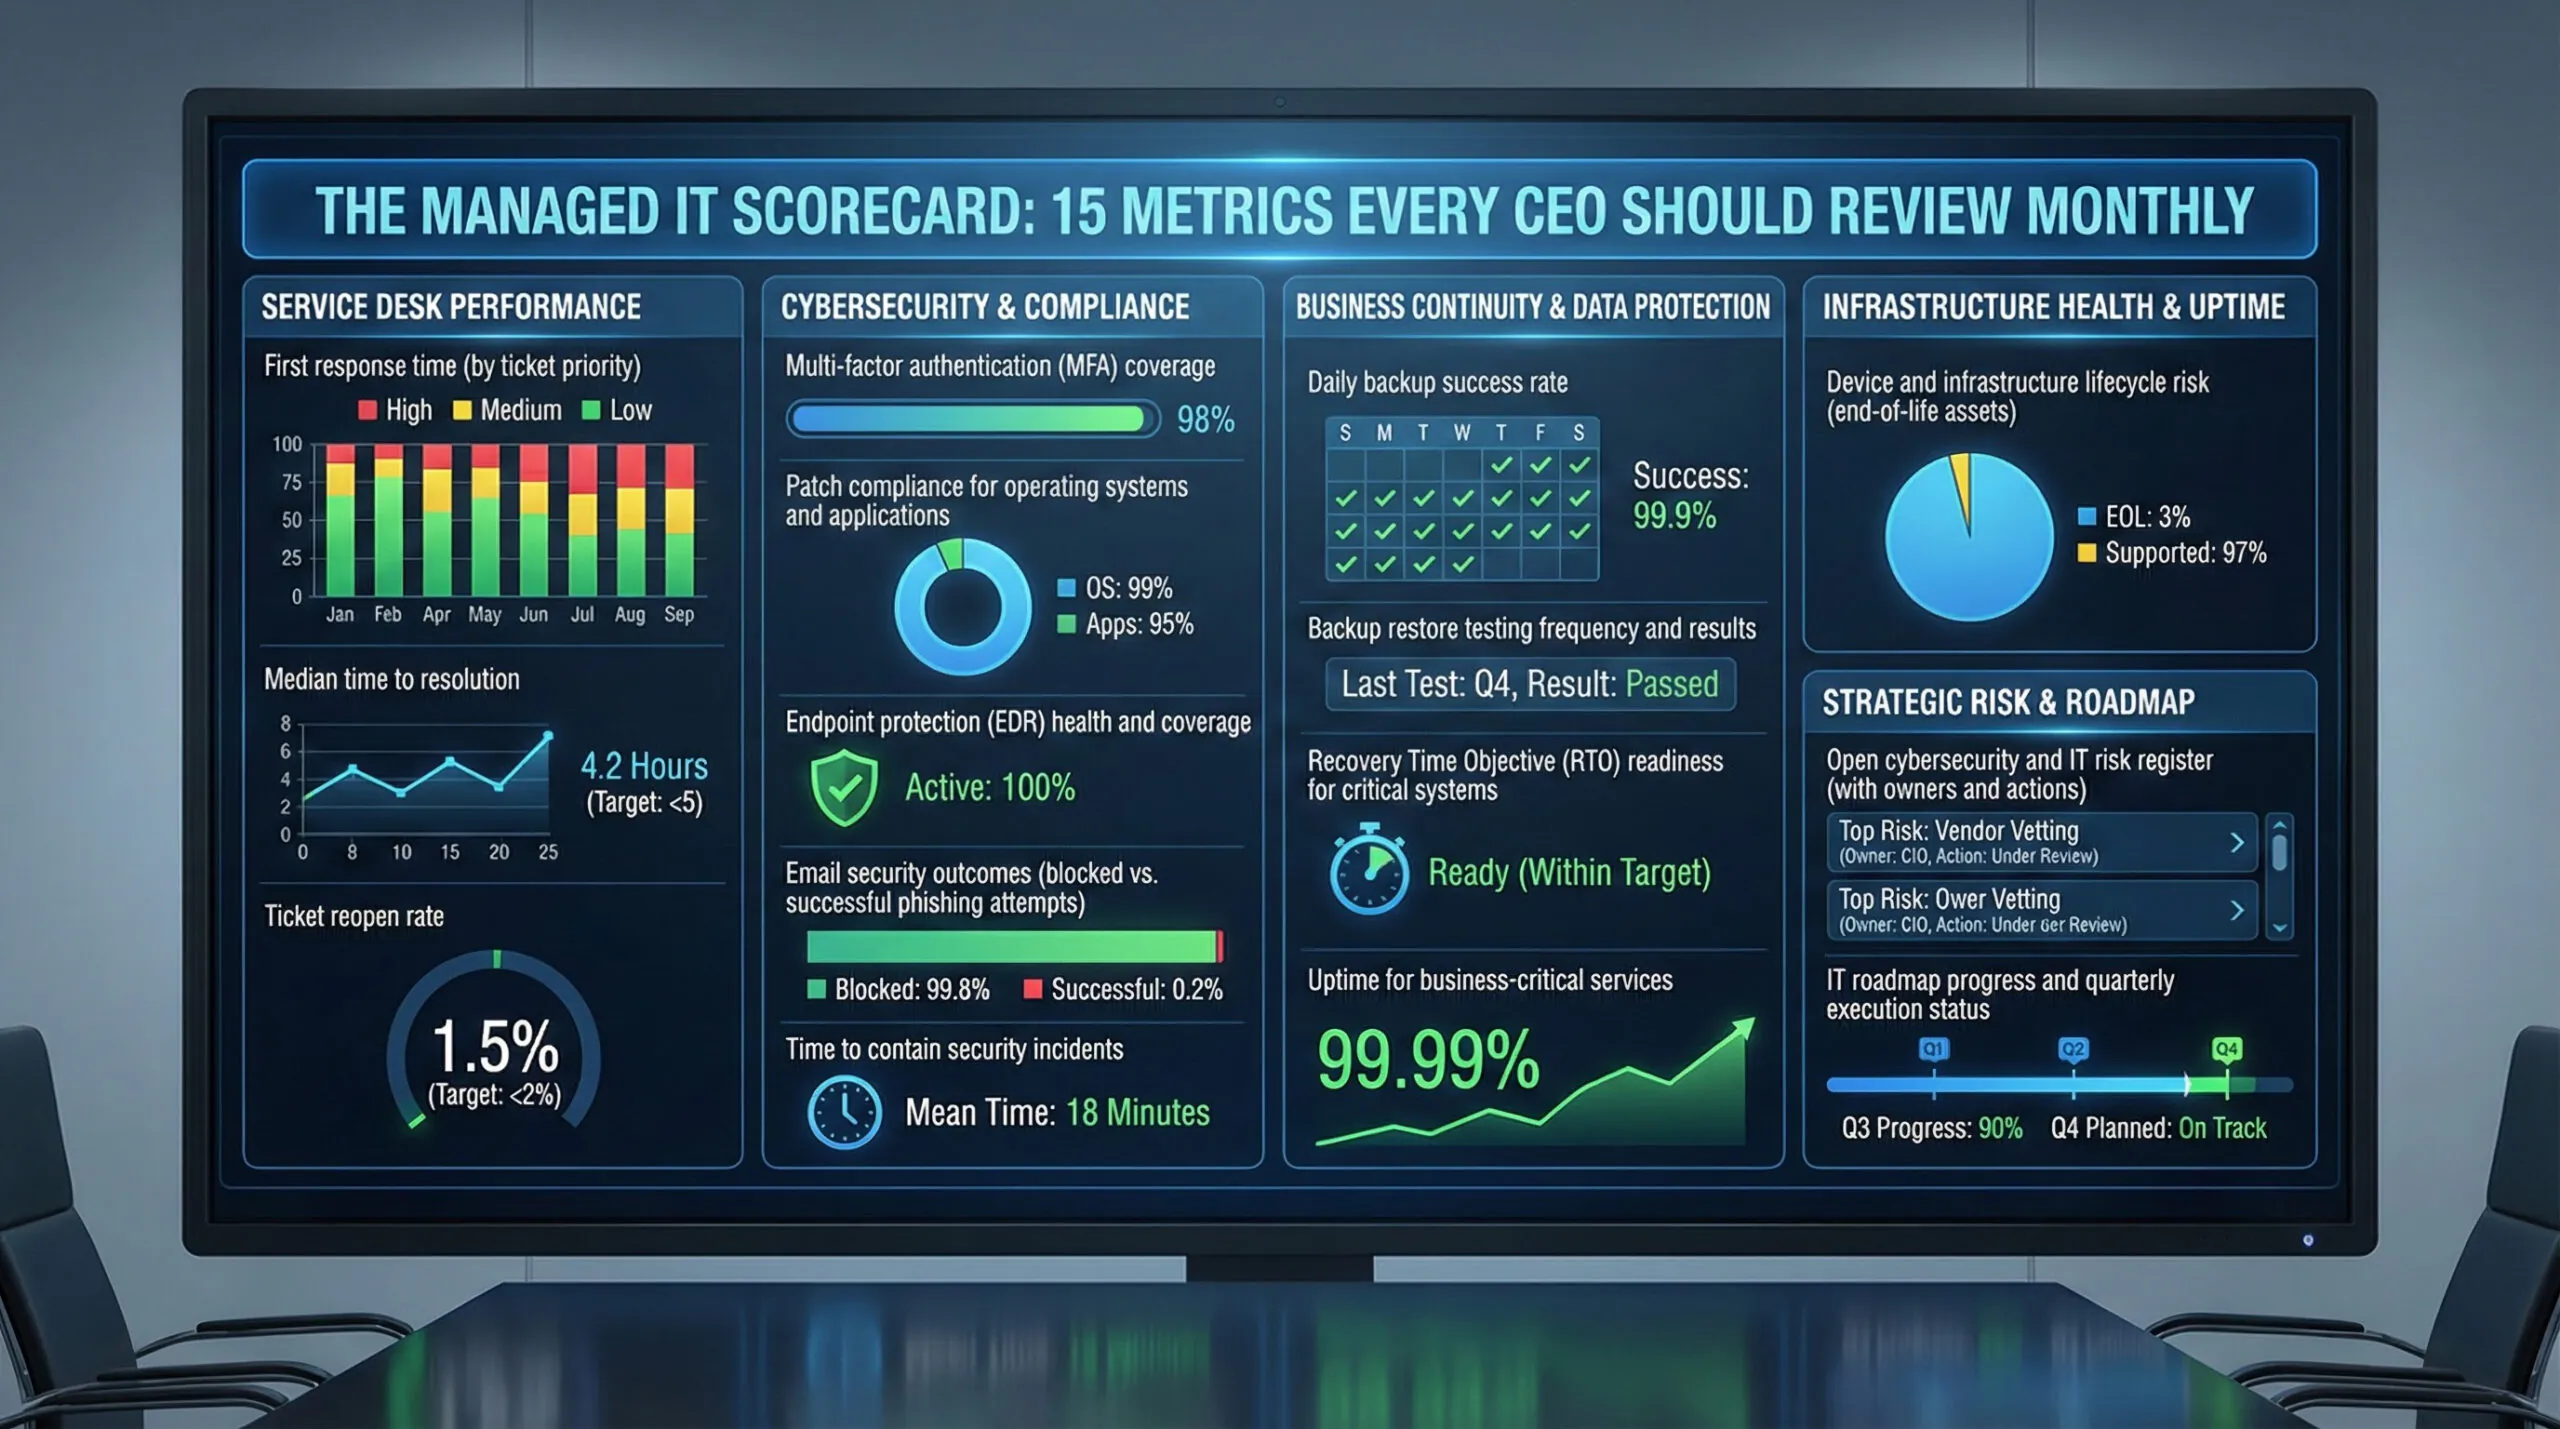
The 15 Metrics That Matter in a Managed IT Scorecard
These are grouped into five categories leaders actually care about:
-
Service Desk & User Experience
-
Security & Risk Reduction
-
Backup, Recovery & Resilience
-
Infrastructure Reliability
-
Governance, Planning & Financial Control
You’ll notice something: these metrics focus on outcomes, not jargon.
Service Desk & User Experience (3 metrics)
🔘 First Response Time (by priority)
How long it takes for a human response after a ticket is submitted—tracked separately for critical vs standard issues.
What “good” looks like:
-
Critical issues: minutes, not hours
-
Standard issues: same business day
What to ask for: a monthly trendline, not a one-time average.
🔘 Time to Resolution (Median, not just average)
Averages get distorted by outliers. Median tells the real story.
Leadership takeaway: Are we getting faster over time?
🔘 Ticket Reopen Rate
If tickets are “resolved” but reopened often, you’ve got band-aids, not fixes.
Ask:
-
Reopen rate by category (email, Wi-Fi, printing, line-of-business apps)
-
Top recurring problems and permanent corrective actions
Security & Risk Reduction in a Managed IT Scorecard (5 metrics)
🔘 MFA Coverage (All users, all privileged accounts)
MFA is table stakes, but “we have MFA” can hide gaps—especially for admin accounts and service accounts.
Ask for:
-
% of users protected
-
% of privileged/admin accounts protected
-
Exceptions list (and why)
Microsoft has been loudly reinforcing “secure-by-default” identity controls and phishing-resistant MFA as a key security priority.
🔘 Patch Compliance (OS + third-party apps)
This should include:
-
Workstations
-
Servers
-
Network gear where applicable
-
High-risk third-party apps (browsers, PDF tools, Java, etc.)
Ask for:
-
% patched within policy (example: 14 days for critical)
-
List of exceptions + mitigation plan
🔘 Endpoint Protection Health (EDR status)
“Installed” isn’t enough. You want to know:
-
Is it active?
-
Is it reporting?
-
Are devices missing protections?
Ask for:
-
Coverage %
-
Devices not checking in
-
High-severity detections and what was done
🔘 Email Security Outcomes (not just tools)
Phishing isn’t going away. The question is: are you getting better at stopping it and reducing user risk?
Ask for:
-
Phishing detections blocked
-
Successful user-reported phish vs missed phish
-
High-risk users (targeted coaching, not shaming)
🔘 Security “Time to Contain”
When something suspicious happens, how quickly is it isolated?
This is a cousin of MTTR (mean time to repair/resolve), a standard operational performance metric used in IT service management.
Ask for:
-
Median time to contain high-risk events
-
What counts as “contained” (clear definition)
Backup, Recovery & Resilience (3 metrics)
🔘 Backup Success Rate (daily)
This should be boring. Boring is good.
Ask for:
-
Daily success rate
-
Failures by system
-
Time-to-fix for failures
🔘 Restore Testing Frequency (proof, not promises)
Backups that haven’t been tested are hope, not strategy.
Ask for:
-
Monthly/quarterly restore tests
-
Results and gaps discovered
-
Changes made afterward
🔘 Recovery Time Objective Readiness (RTO)
You don’t need perfect RTO for everything. You do need defined targets for critical systems.
Ask for:
-
The agreed RTO for key systems
-
Whether you can realistically hit it
-
The top blockers (budget, configuration, vendor, bandwidth)
Infrastructure Reliability (2 metrics)
🔘 Uptime by critical services
Track uptime for what matters:
-
Internet connectivity / SD-WAN
-
Core network
-
Microsoft 365 identity access
-
Line-of-business apps
-
File access / cloud storage
Ask for: incidents + root cause + prevention plan.
🔘 Device Lifecycle Risk (aging hardware)
Old firewalls, end-of-life servers, and neglected switches are silent risk multipliers.
Ask for:
-
Inventory of “at risk” infrastructure
-
Replacement priority list
-
Timeline and budget ranges
Governance, Planning & Financial Control (2 metrics + 1 meeting)
🔘 Open Risk Register (top 10)
This is where “Govern” becomes real. NIST CSF 2.0 explicitly elevated governance—cybersecurity is enterprise risk, not just an IT task.
Ask for a simple table:
-
Risk description
-
Business impact
-
Likelihood
-
Current controls
-
Next action + owner + due date
🔘 IT Roadmap Progress (quarterly)
Not a wish list—an execution plan.
Ask for:
-
Top initiatives
-
Status (on track / at risk)
-
Decisions needed from leadership
-
Budget impact
The One Meeting That Makes the Managed IT Scorecard Work
This meeting structure is what turns a managed IT scorecard into an ongoing operating rhythm, not a one-time report.
If you do nothing else, implement this:
🌟 A 30-minute monthly IT scorecard review.
Attendees: a business leader + IT owner + MSP/vCIO.
Agenda:
-
Top 3 wins (measurable)
-
Top 3 risks (with owners)
-
Scorecard metrics trendline review
-
Decisions needed (yes/no choices)
This is how managed IT stops being a “vendor relationship” and becomes managed outcomes.
A Simple Scorecard Template You Can Copy
Here’s a lightweight example format:
|
Category |
Metric |
Target |
This Month |
Last Month |
Trend |
Notes / Action |
|---|---|---|---|---|---|---|
|
Service Desk |
First response (critical) |
< 15 min |
12 min |
18 min |
↑ |
After-hours routing fixed |
|
Security |
MFA coverage (all users) |
100% |
96% |
96% |
→ |
4 users pending rollout |
|
Security |
Patch compliance (critical) |
95%+ |
93% |
97% |
↓ |
12 devices failing check-in |
|
Resilience |
Backup success |
99%+ |
99.6% |
98.9% |
↑ |
New alerting tuned |
|
Governance |
Top risks with owners |
10 tracked |
10 |
8 |
↑ |
Added vendor access risk |
You don’t need perfection on month one. You need consistency and visibility.
💡A managed IT scorecard gives leadership a consistent, repeatable way to review IT performance without relying on anecdotes or gut feel.
🚩 Common Red Flags This Scorecard Will Reveal
If you’re seeing these patterns, the scorecard is doing its job:
-
“We don’t track that.” (Translation: you’re flying blind.)
-
Metrics look good, but repeat issues stay high. (Band-aids.)
-
Lots of tools, little reporting. (Tool-sprawl without outcomes.)
-
No restore testing. (Ransomware readiness is questionable.)
-
No risk register. (Leadership isn’t getting the full story.)
💡 How do we avoid “vanity metrics”?
Tie each metric to a business question:
-
Does it reduce risk?
-
Does it improve uptime?
-
Does it improve employee experience?
-
Does it control cost?
If it doesn’t answer one of those, it’s probably noise.
My Final Thought
Managed IT shouldn’t feel like a subscription you hope is working.
When reviewed monthly, a managed IT scorecard turns IT from a reactive cost center into a measurable, accountable, and continuously improving—without turning leadership meetings into technical rabbit holes.
If you’d like a pressure-free second set of eyes, talk it through with a Doceo IT Advisor, you can always connect here: https://www.mydoceo.com/lets-talk.